WTO/FTA Negotiation
and Recent Trend of Rice Market
---with respect to the implication on rice consumption
level----
Masaru KAGATSUME
Professor,
Graduate
<Contents>
1.
Introduction
(1)Outline of Agricultural
Negotiation Result of the
(2)Shifting into the rice tariffication system in April, 1999
2.
Reform of Rice
Distribution System
3. Situation
of Rice Import & Reserve Stock
4. Determining
Factors of Rice Demand
1. Introduction
(1) Outline of Agricultural Negotiation
Result of the
When GATT Uruguay Round had concluded
in 1994 and the liberalization process started,
As for minimum access measures, the
government has charges the mark-up through the state trade from the imported
rice. The minimum access quantity was started in 1995 with importation of 4% equivalent of the
domestic consumption in basis period (1986-1988) and this was planned to increase
to 8% equivalent in final year of the agreement 2000. This means rice import
had to be increased every year by 0.8% of base year total consumption. In
volume terms, 379 thousand tons of milled rice was imported in 1995 and this
was planned to increase to import
of 758 thousand tons milled rice in 2000.
The Mark-up charge was set based on the
gap between selling price and buying price of the imported rice (Thailand Rice)
purchased by the government food agency in the basis period (1986-1988). This
is sort of specific tax of maximum \292/kg.
In addition to these, the simultaneous
buying-selling system (SBS) was introduced in order to establish reasonable
domestic market evaluation of the imported rice following the minimum access.
The same system was applied to the rice processing commodities.
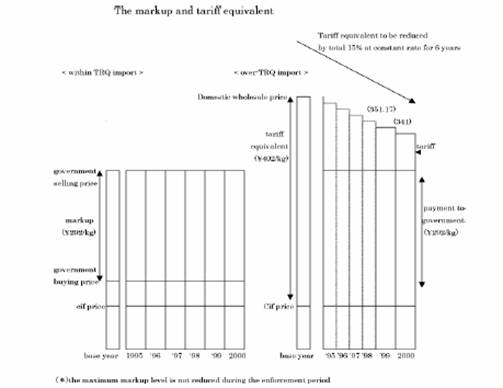
(2) Shifting into the rice tariffication system in April, 1999.
The agreement on tariffication under
Uruguay Round required for the first tariff rate quota ( minimum access ) to be
increased from import of 3 % of domestic consumption in base year to 5% i.e.
0.4% increase per year. But Japan accepted the minimum access option with more
compromised way, i.e, increasing rice import from 4% to 8% of the base year
consumption i.e. 0.8% increase per year. So, after
In 1999, under the old
minimum access system, rice import would be 767 thousand tons ( paddy ) but
under the tariffication system, this would be reduced to 724 thousand tons in paddy base. In milled rice base,
these reduction were from 682 thousand tons to 644 thousand ton in milled rice
base ). As for year 2000, this rice import reduction was from 852 thousand tons
to 767 thousand tons in paddy base. In milled rice base, this rice import
reduction would be from 758 thousand ton to 682 thousand ton in milled rice
base. These changes are summarized in the following way.
a) abolishment of licensing of rice trading.
Licensing system of rice export-import is abolished, following
this, the compulsory selling of rice
imported through permission to government is abolished.
b) implementation of payment to government for rice import.
For rice which is imported under the
second (over quota) tariff rate, the government can charge one part of
second tariff rate as a payment to the government ( \292/kg ).
This
payment to the government from the rice import is appropriated for the imported
food administration account of the staple food administration special
account.
c) implementation of the
notification system on rice import-export.
The rice import-export have to be
notified to the government.
d) setting the second ( over quota ) tariff rate.
<1> the basic primary
rate( \402/kg ) is set to be tariff equivalent based on the agricultural agreement
<2>
the second ( over quota ) rate is calculated based on the agreement. The rest of the second rate from
which the payment to government is deducted was set to be the preliminary rate.
Second rate
of which, preliminary rate
1999
\351.17/kg
\59.17/kg
2000 \341/kg \49/kg
<3> rice can be protected by the
special emergency tariff system ( special safeguard system)
Figures 1 to 4
show the detailed contents of rice tariffication after 1999 in
Figure 1 Content of rice tarification in
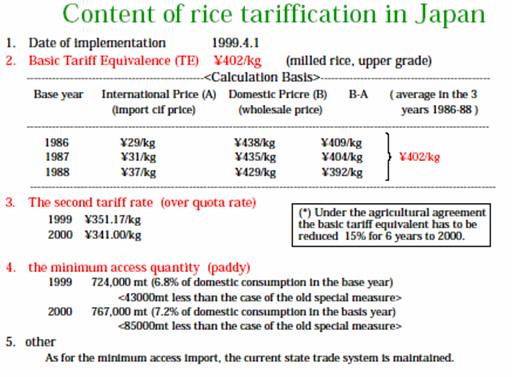
Figure 2 The mechnism of the switching to
tariffication
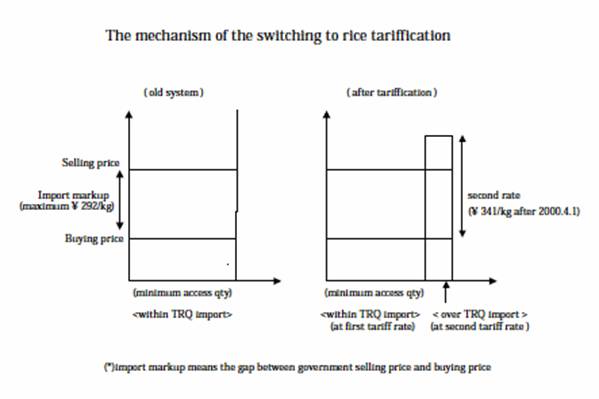
Figure 3 Comparison of minimum access quantity
before and after tariffication system
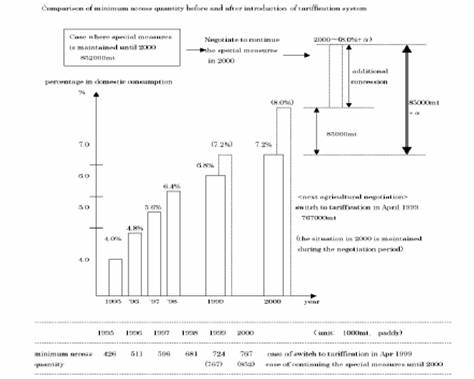
Figure 4 Comparison of minimum access quantity
before and after tariffication system
Since the acceptance of rice tariffication,
border protection measures are almost deregulated and very trivial level in
Maybe, this is due to the facts that
until recently
At the time
of negotiation of WTO new round, the chairman of agricultural committee, Mr Harbinson had announced the Modality Proposal. The characteristics
of his proposals are that two measures of tariff peaks and tariff escalation
should be deleted.
2. Reform of Rice
Distribution System
Rice Distribution System
has long been controlled by Food Control Law enacted in 1941. Under the
Food Control Law, Government bought rice at the higher producer price and sold
it to the consumer at the lower consumer price. Which had caused huge budget
deficit and surplus rice. And so, in order to curtail the budget deficit based
on government rice, government began to introduce paddy field diversification
scheme. Also, government introduced
Voluntary Distributed Rice system, where the consumer price was higher
than the producer price in 1969. The weight of this Voluntary Distributed Rice
in total rice market has been expanding and became more dominant part than the
government distribution rice. In addition to these 2 channels of rice market,
the freely (unregistered) distributed rice channel had emerged illegally and
gradually expanded to the similar weight to the government distribution rice
channel and voluntary distribution rice channel. The rice distribution channels
under the Food Control Law has been changed and revised several times. In 1990,
Voluntary Distributed Rice Price Formation Organization was established and
rice prices began to be guided by the market situation of voluntary
distribution rice rather than the government distribution rice.
In 1992, New Agricultural Policy was introduced and following
this, at long last, the food control law was abolished in 1995 when New Food
Law was introduced. Under the New Food Law, new rice distribution system, so
called, the Planned Distributed Rice system was introduced. In this
distribution system, rice prices were expected to be guided by the Planned
Distributed Rice price which was formed by the kind of auction style organized
by rice price formation center. In this system, all of Planned Distributed Rice had to
be traded by the registered market dealers. The rice distribution channels
under the Planned Distributed Rice system are shown in the following Figure 5.
However, the weight of unplanned distributed rice trade has
gradually expanded and so, the price formation system by this center did not
function effectively. So, this
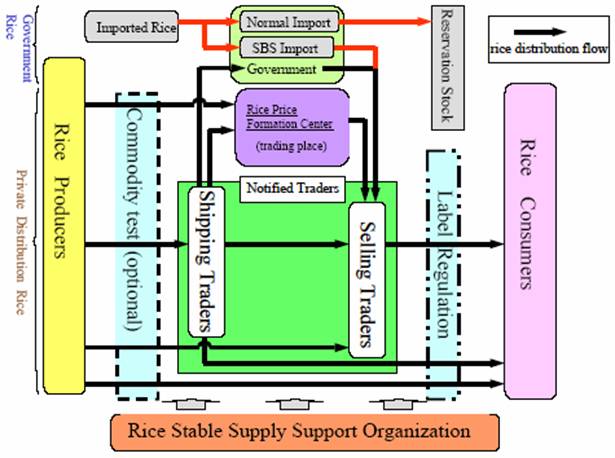
Planned Distributed Rice system was also abolished in April 2004. Since then,
rice distribution channels were totally deregulated and liberalized. Now, rice
can be retailed at convenience stores. This new rice
distribution system is shown in Figure 6.
Figure 5 Rice Distribution Channels under the
Planned Distribution Rice System
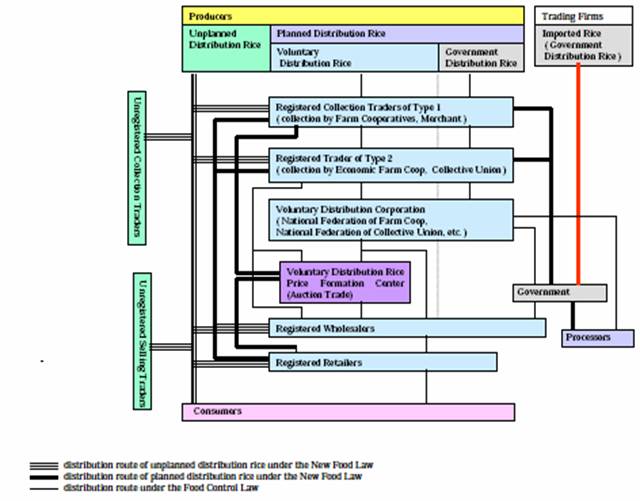
Figure 6 Rice Distribution after abolishment of
Planned Distribution Rice System
3.
Situation of Rice
Import and Reserve stock
Rice import
situation in 2003 fiscal year was as follows. Under the minimum access system
based on the Uruguay Round Agreement since 1995, rice import has maintained at
the level of 0.77 million tons of paddy, of which SBS rice import was 0.10
million tons.
Moreover, 0.08
million tons of glutinous rice were imported in order to stabilize supply. This
was twice level of the usual year.
All of the 0.10
million tons of SBS imported rice were sold out through auction although only
0.05 million tons ( half of the predicted amounts ) of SBS import rice were
sold in the previous year 2002.
Rice import in 2004 fiscal year was almost similar
to preceding year. Until the new agreement in WTO is realized, the Minimum
Access import is maintained at the same level of 2000 and so, 0.77 million tons
of paddy were imported in 2004. Also, 0.10 million tons of paddy are imported
under the SBS import system through the 4 auctions a year.
The demand for the minimum access rice is shown as following Figure 7.
Figure 7 Demand for the Minimum Access Rice
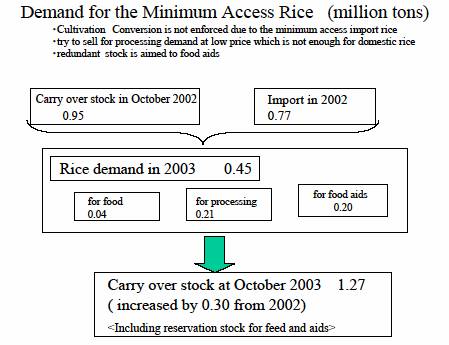
And reserve stock of rice was accumulated at the level of 1.63
million tons at June 2003, which was exceeding optimal reservation level of 1
million tons. However, this stock decreased to the level of 0.73 million tons
at June 2004 due to strong demand by wholesaler and production declined after
August 2003.
On the other
hand, the rice stock by wholesalers increased to 0.76 million tons at February
2004, increased by 0.43 million tons from preceding year.
As for the rice
reserve tock policy, Japanese government has set optimum stock level
to be 1 million tons. This is planned to be managed by Revolving Reserve stock
method by 0.5 million tons a year and not by Set Aside method
The trading of reserve stock rice would be changed from Arbitrary Negotiation (Direct trading) system to Auction trading (bidding) system
As already explained, rice import is
carried out through the 2 routes.
One is SBS import system and the other is general ( normal ) import. The
recent situations of both import routes are shown in the following figures (
Figures 8 and 9 on SBS import rice and Figures 10 and 11 on MA general import
rice, respectively). In this figure
8, it is shown that as long as SBS import rice is concerned, the share of
.
Figure 8 Quantity of SBS import rice
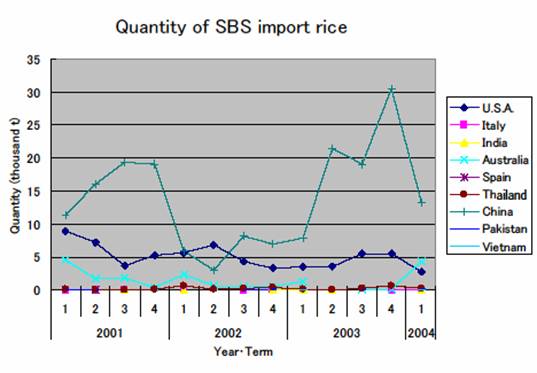
Figure 9 Selling-Buying price gap of SBS import
rice
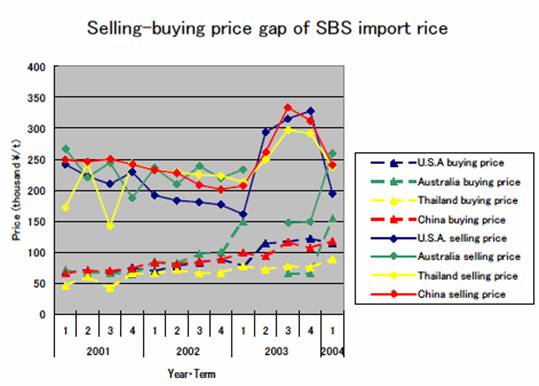
Figure 10 Quantity of MA general import rice
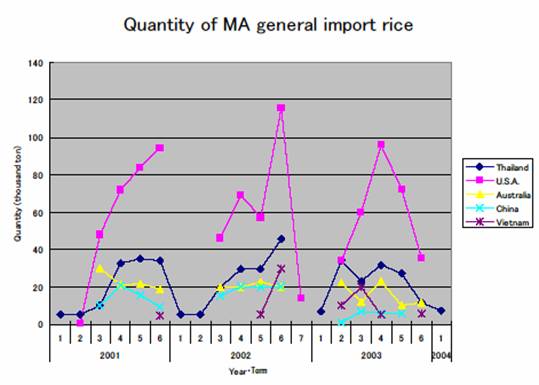
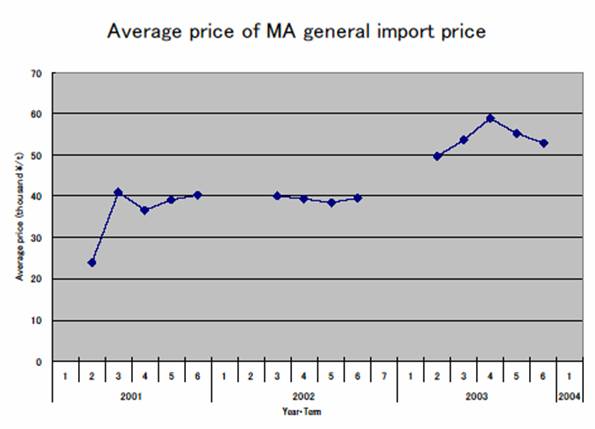
Figure 11 Average Price of MA general import rice
4.
Determining Factors
of Rice Consumption Demand
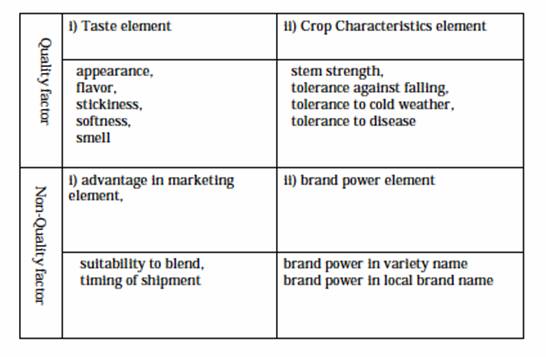
According to
the market behavior theory, factors affecting rice price gaps are categorized
as follows. First of all, these affecting factors are classified into quality
related factors and non quality related factors. The quality related factor
consists of taste element and crop characteristics element. And the non quality
related factor consists of advantage-in-marketing element and brand power
element. The component parts of taste element are appearance, flavor,
stickiness softness and smell. The component parts of crop characteristics
element are stem strength, tolerance against falling, tolerance to cold weather
and disease. The component parts of advantage-in-marketing element are blend
suitability and shipment timing. The component parts of brand power element
consist of brand powers in variety name and in local brand name. Taste element
and brand power element are considered as the consumer side conscious elements.
The crop characteristics elements and advantage-in-marketing element are
considered as the producer or supplier side conscious elements.
Table 1 Factors affecting on Rice Consumption
Demand and Price
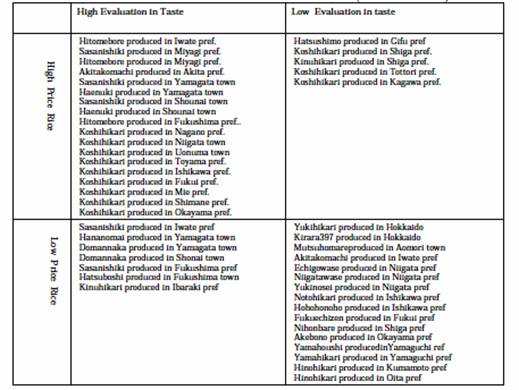
According to the
research results based on the cluster analysis, rice varieties and brands are
categorized into 4 regions formed by combination of dichotomy in their taste
levels and dichotomy in their price levels (Table 1). If rice price are
determined perfectly by its taste evaluation only, all rice varieties and
brands should be located in the diagonal regions, in other word, in the region
of combination of high evaluation in taste and high price rice or combination
of low evaluation in taste and low price rice. However, in
Table 2 Relations between Rice Price and Taste
Evaluation (
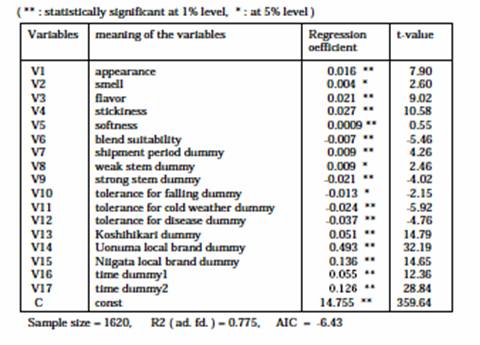
In order to confirm these results, the hedonic regression analysis was carried out. Dependent variable is rice price gap and explanatory variables are each elements of rice price affecting factors which were shown in the above Table 1.
According to the results of hedonic regression
approach, the variable of Uonuma local brand dummy has the most significant and
biggest impacts on price gaps between the rice brands classified by the
producing areas. Nextly, the
variable of
The
interesting fact is that the factors of taste element of the rice quality
related factors, such as appearance, flavor, stickiness, softness or smell, did
not show strong impact at all.
Also, crop characteristics elements, such as stem strength, tolerance
against falling, tolerance to cold weather or tolerance to disease, did not
show strong impacts on price gaps among rice varieties and brands (Table 3).
As for the
non-quality related factors such as blend suitability or shipment timing,
they were not significantly affecting on price gap.
Judging from those results, it is pointed out that the most important one among
4 elements of rice price gap determining factors was brand power elements which
consist of brand power in variety name and brand power in local brand name.
Table 3 Results of Hedonic Regression Analysis